
A nation’s intelligence can’t be reduced to a single test score. True national intelligence is shaped by a combination of strong education, investment in science and research, and a population equipped with problem-solving skills. The countries that bring all three together are the ones that stand out. That is why the team at TradingPlatforms.io has set out to create a comprehensive ranking of the world’s smartest nations.
To do this, we analysed the latest results from the OECD’s PISA 2025 assessment across mathematics, reading, science, and computational problem-solving. We then combined the average score for each country with its high-quality research output and national average IQ to give 80 countries around the world a comprehensive Smartness Score between 0 and 100.
Each country’s Smartness Score is calculated using its average PISA 2025 results across math, reading, science, and computational problem-solving, its high-quality research output per million residents, and its average national IQ. Hover over any country for the full breakdown.
Data source: OECD, Nature Index, World Population Review, International IQ Test
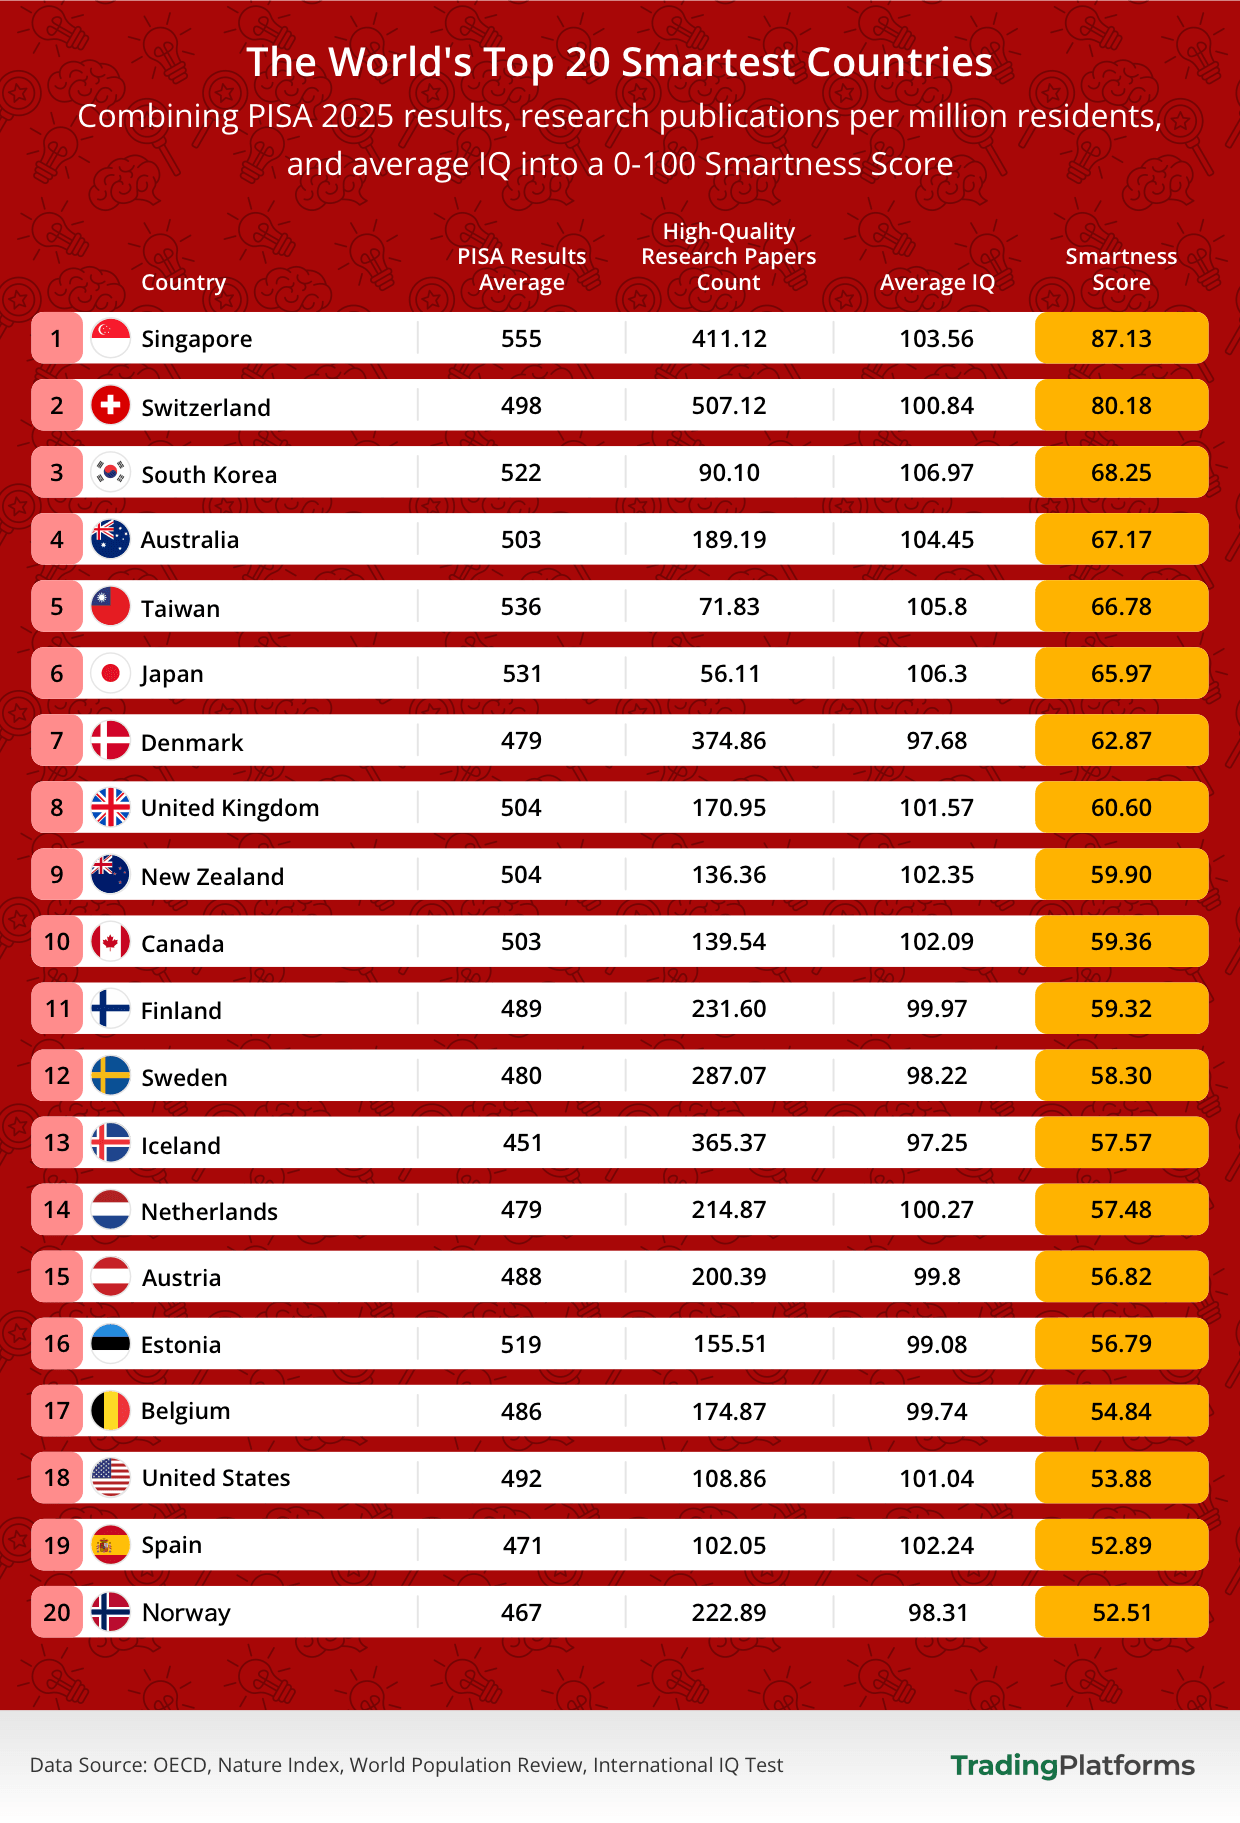
Singapore ranks first among the 80 nations analysed, with a Smartness Score of 87.13 out of 100. The country’s 15-year-olds performed exceptionally well in the PISA 2025 assessment, recording the highest scores in all four subjects (maths, reading, science, and computational problem solving) out of every country in the analysis, with a PISA 2025 average of 555 points.
Switzerland achieves an overall Smartness Score of 80.18/100. The country stands out particularly for its research output, recording 507.12 high-quality publications per million residents, the highest figure in the study. Alongside Switzerland’s PISA average of 498 and average IQ of 100.84, it ranks as the smartest country in Europe and the second smartest globally.
East Asian countries command a substantial presence among the world’s smartest nations. South Korea ranks as the 3rd smartest nation with a Smartness Score of 68.25/100, supported by a PISA average of 522 and an average IQ of 106.97, the highest in the top 20. Taiwan ranks 5th with a score of 66.78/100, while Japan takes 6th place at 65.97/100.
All five of the Nordic countries appear in the global top 20. Denmark leads the region in 7th place with a Smartness Score of 62.87/100, with a substantial scientific output of 375 high-quality research publications per million residents and a PISA average of 479 points. Finland ranks 11th with a smartness score of 59.32/100, followed by Sweden (58.30/100), Iceland (57.57/100), and Norway as the 20th smartest country with a smartness score of 52.51 out of 100 points.
Australia ranks as the smartest English-speaking Commonwealth country, with a Smartness Score of 67.17 out of 100. Its position is supported by a high average IQ of 104.45, the fourth-highest in the study, alongside substantial scientific output of 189.19 high-quality research publications per million residents. The United Kingdom ranks 8th globally with a Smartness Score of 60.60/100, combining a PISA average of 504 with the study’s largest overall volume of high-quality research publications, at 11,955. New Zealand ranks 9th at 59.90/100, followed by Canada in 10th place at 59.36/100. The United States ranks 18th with a Smartness Score of 53.88/100, despite producing by far the largest number of high-quality research publications in absolute terms, at 37,995 in 2025.
Cognitive Ability by Country
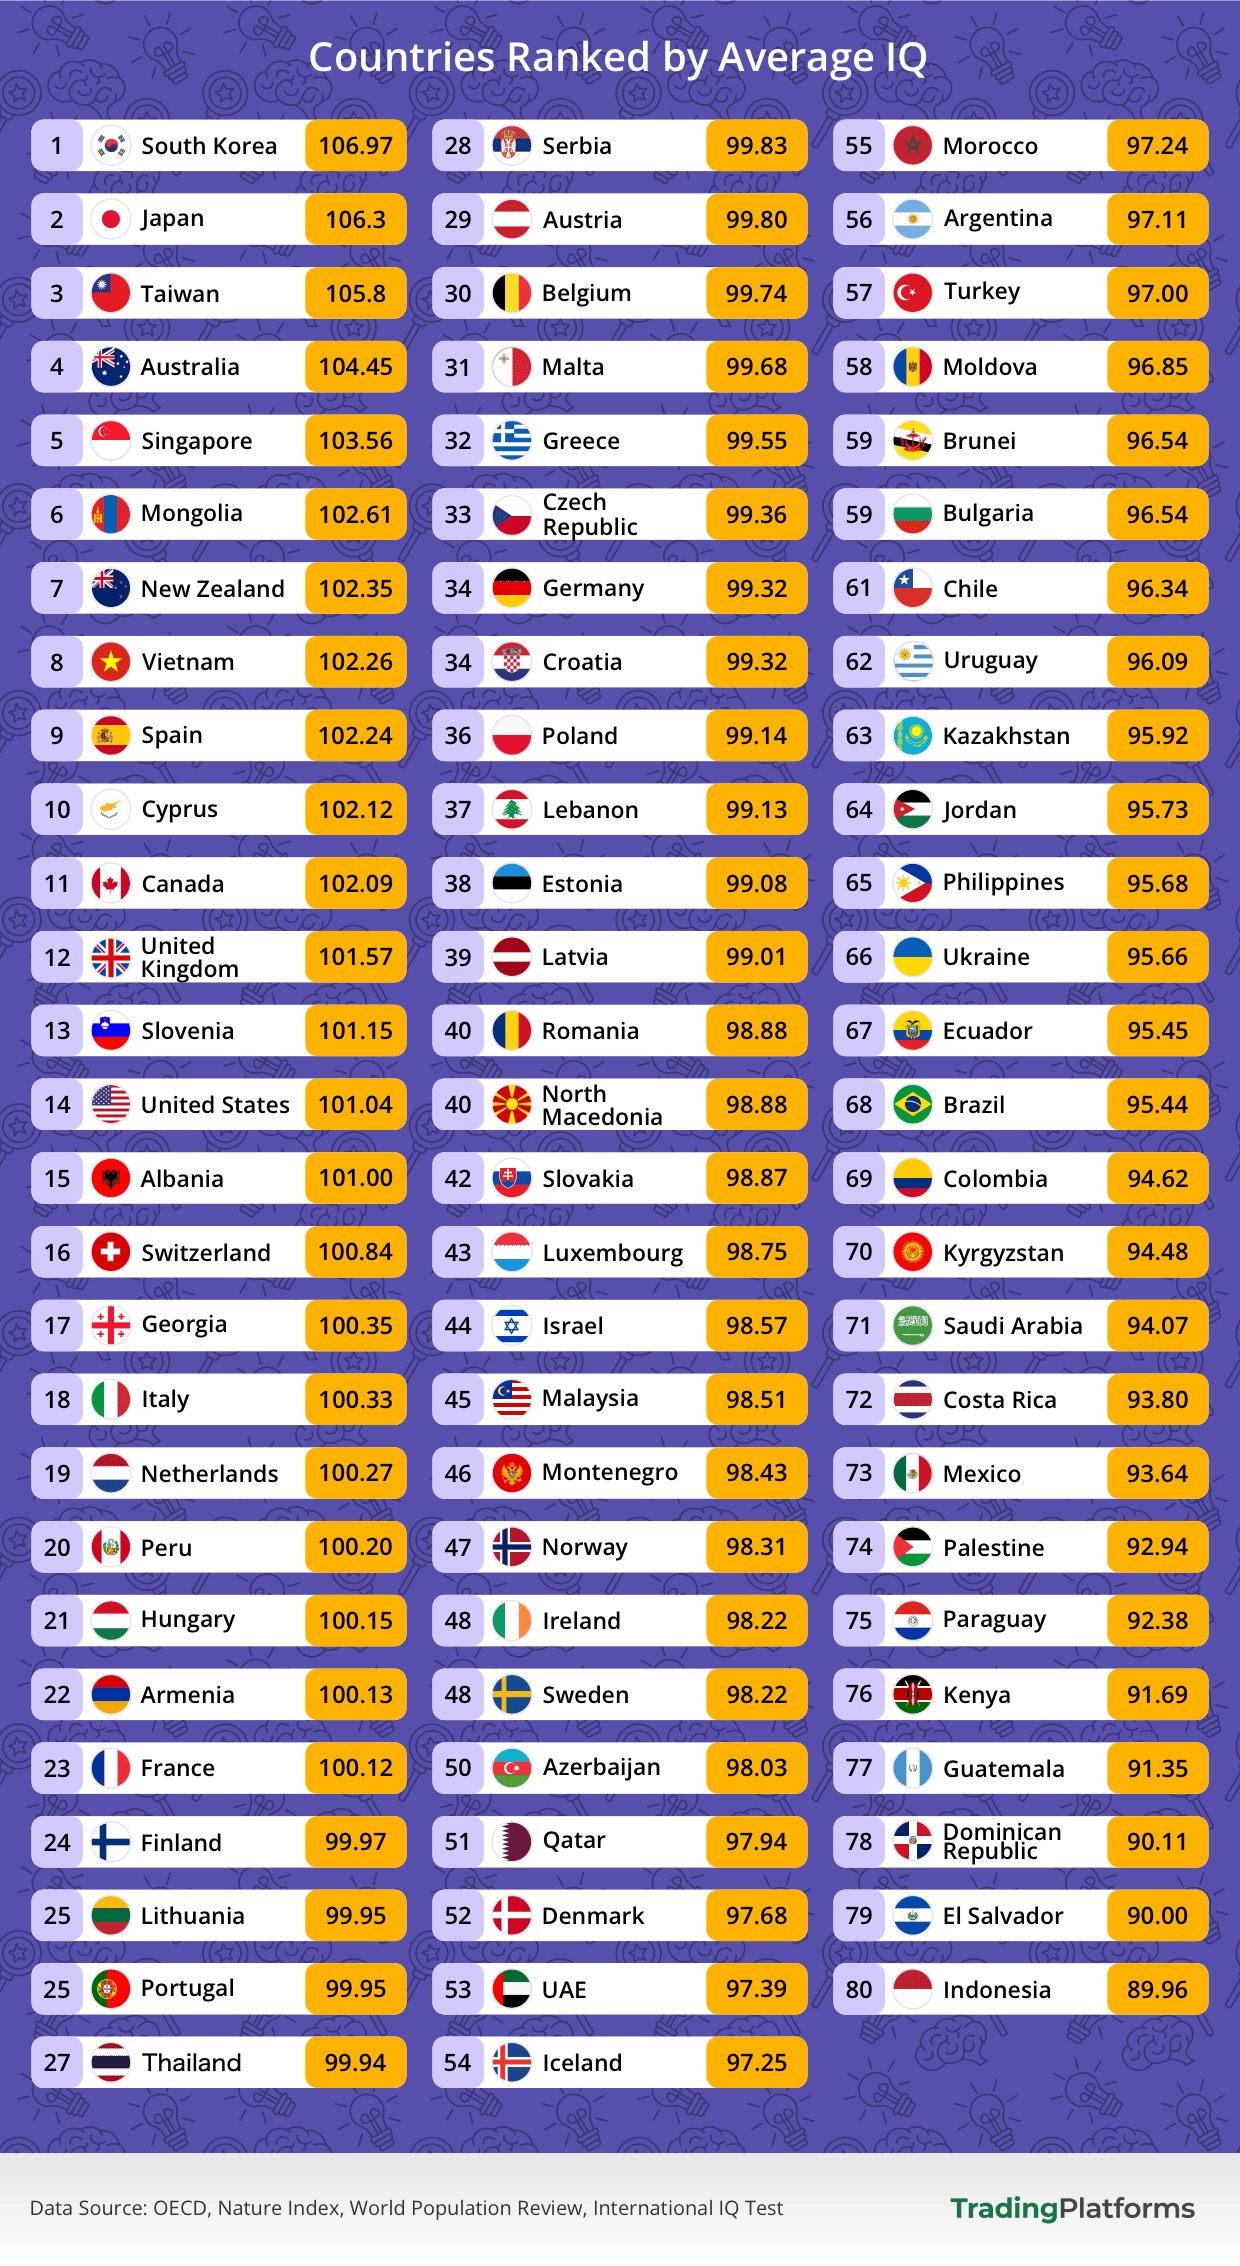
Many of the countries ranking the highest for average IQ are East Asian, including the top three countries in the ranking. South Korea leads the study with an average IQ of 106.97, followed by Japan with 106.30 and Taiwan with 105.80. Singapore ranks fifth globally, with its citizens boasting an average IQ of 103.56, while Mongolia and Vietnam record averages of 102.61 and 102.26, respectively.
Outside Asia, Australia ranks 4th globally with an average IQ of 104.45, with New Zealand at 102.35 and Canada at 102.09. High average IQs across East Asia and the wider Asia-Pacific region are no accident. This strongly coincides with well-developed education systems that place a strong emphasis on academic achievement, mathematics and science, and with a broader pattern first documented by researcher James Flynn, who found that average scores rise as schooling, nutrition and living standards improve.
Spanish citizens have the highest average IQ on the European continent at 102.24. Several other European nations record average IQs above the 100-point mark. The average IQ in the UK is 101.57, while Switzerland has an average IQ of 100.84. Italy (100.33), the Netherlands (100.27) and France (100.12) round out the remainder of the European nations with the highest average IQs.
Across Latin America, the Middle East and parts of Southeast Asia, scores generally fall further, with Peru at 100.20, Argentina at 97.11, Chile at 96.34, Brazil at 95.44, Mexico at 93.64 and Indonesia at 89.96. These differences should not be interpreted as measures of innate ability between populations: average IQ results can be affected by education, nutrition, socioeconomic conditions, familiarity with testing, and the methodologies used to produce national estimates.
The Countries Producing The Most Scientific Research Per Capita
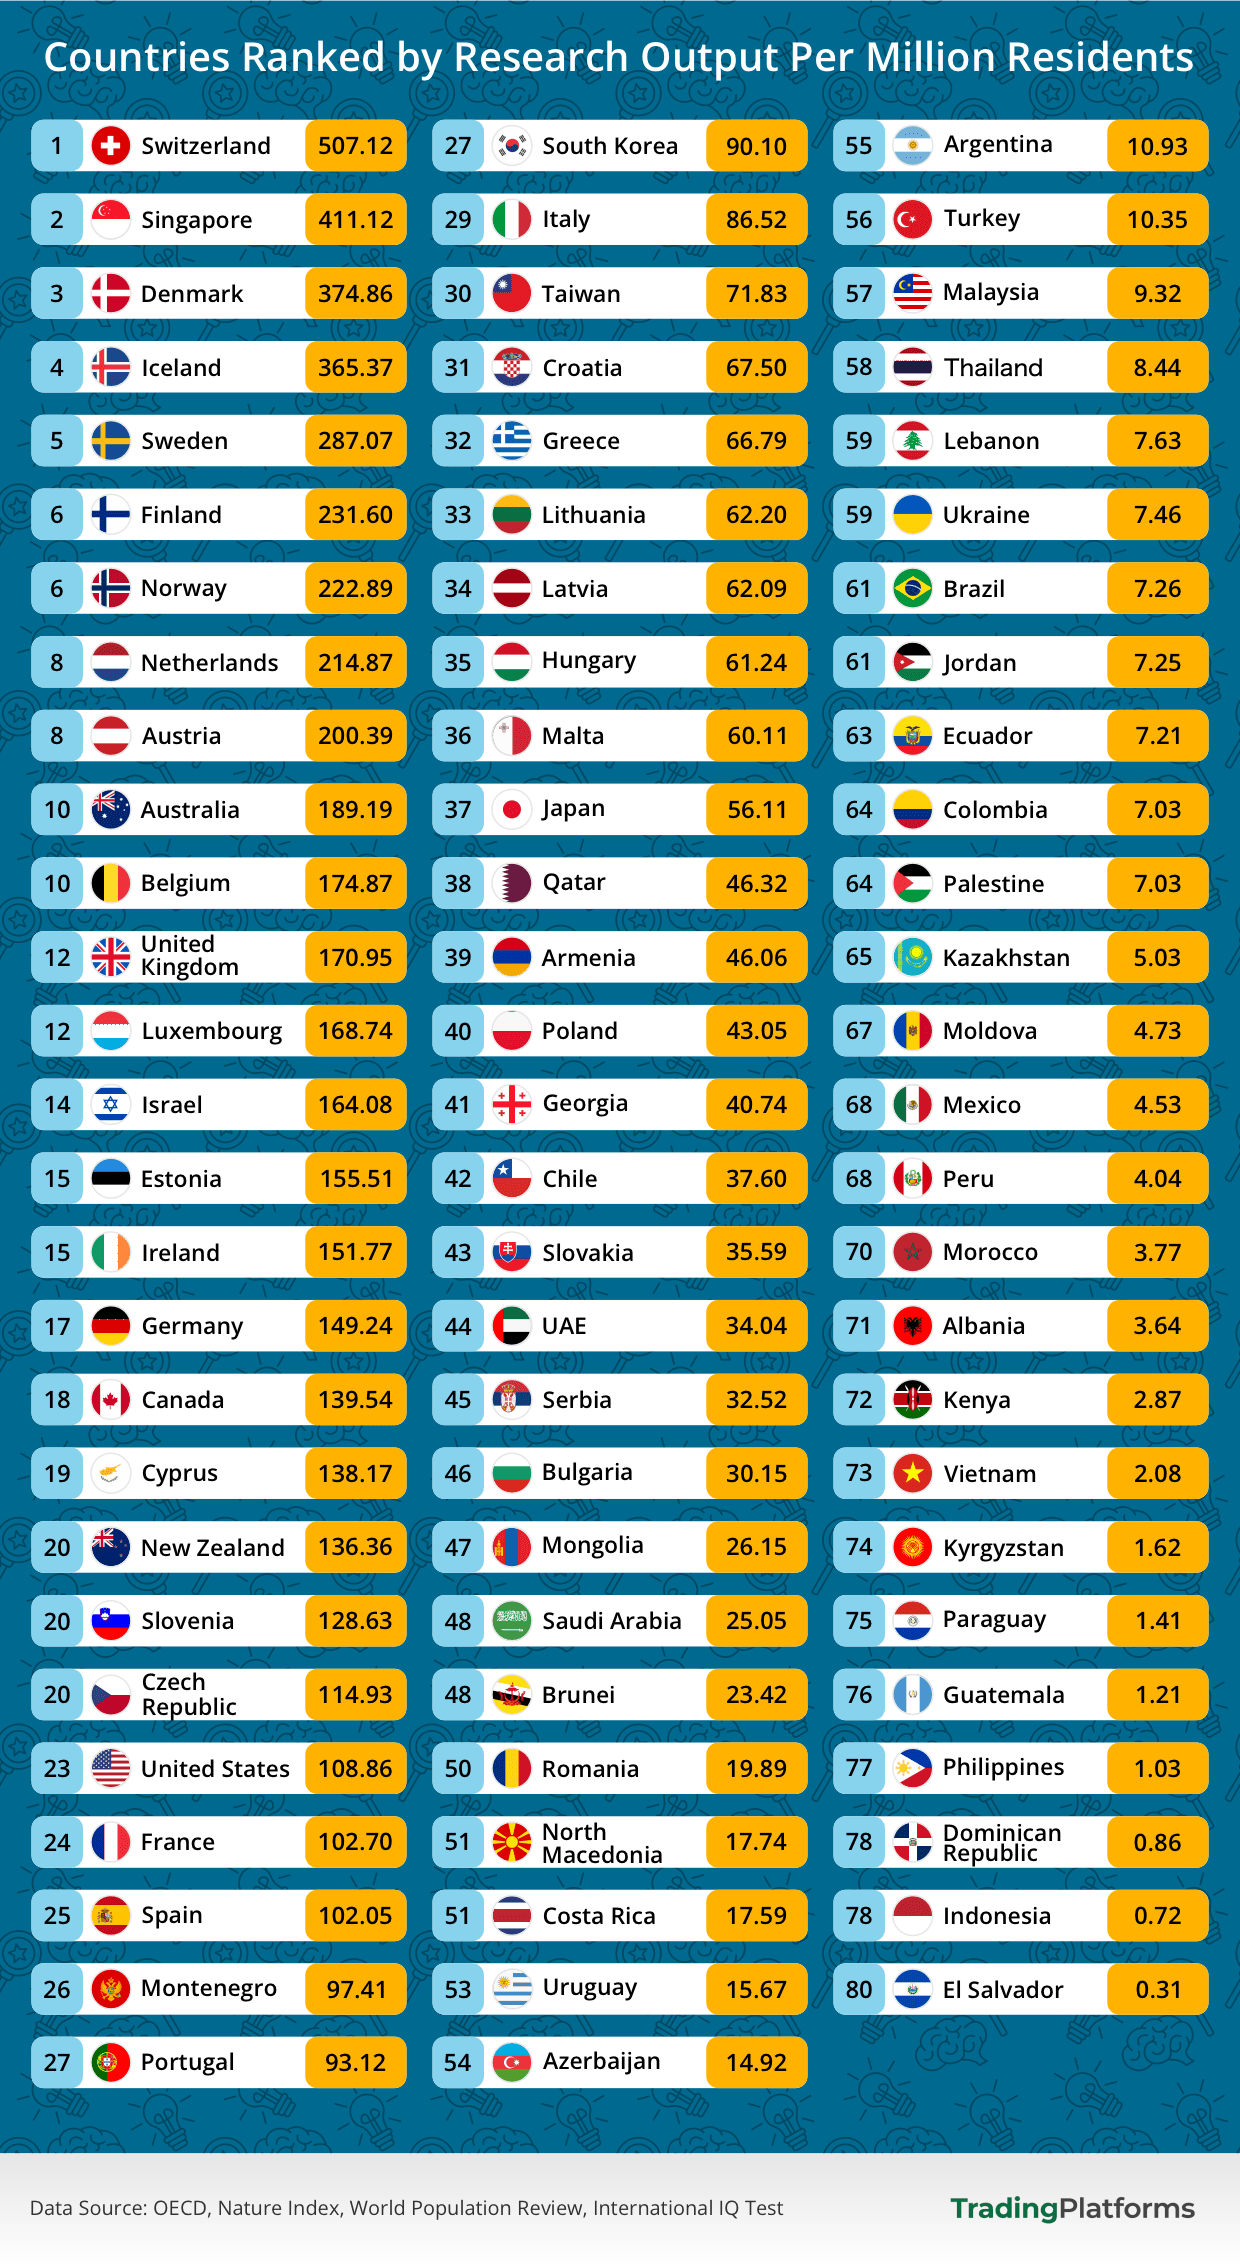
Switzerland stands at the top of the scientific output ranking. Despite having a population of roughly 9 million, Swiss research institutions produced 4,568 high-quality scientific publications in 2025, equivalent to 507.12 papers per million residents, the highest research-to-population ratio among the 80 countries analysed. Switzerland’s research output is a result of its world-famous research and science institutions, most notably ETH Zurich and EPFL, which consistently rank among the world’s leading universities.
Singapore is another country that punches well above its weight in terms of scientific research. With a population of just under 6 million, the country produced 2,428 high-quality publications in 2025, giving it a research output of 411.12 papers per million residents. Singapore has spent decades deliberately building a research-intensive economy, with institutions such as the National University of Singapore, Nanyang Technological University, and the A*STAR research network forming the backbone of its science and technology ecosystem.
The Nordic countries also record substantial research output per capita. Denmark ranks third overall at 374.86 publications per million residents, followed by Iceland at 365.37, Sweden at 287.07, Finland at 231.60 and Norway at 222.89. Although their research systems differ, the five countries share strong university networks, high levels of public and private R&D investment and a large pool of researchers relative to their populations.
In terms of absolute scientific output, the United States remains by far the global leader, with its scientific institutions producing 37,995 high-quality research publications in 2025. This enormous research ecosystem spans universities, national laboratories and specialist research centres across a wide range of scientific fields. Germany ranks second with 12,483 scientific publications, supported by its world-class universities and major research organisations such as the Max Planck Society, Fraunhofer Society and Helmholtz Association. The United Kingdom follows closely with 11,955 publications, with globally recognised universities such as Oxford, Cambridge, and Imperial College London helping sustain its position as one of Europe’s leading scientific research hubs.
Global PISA 2025 Performance
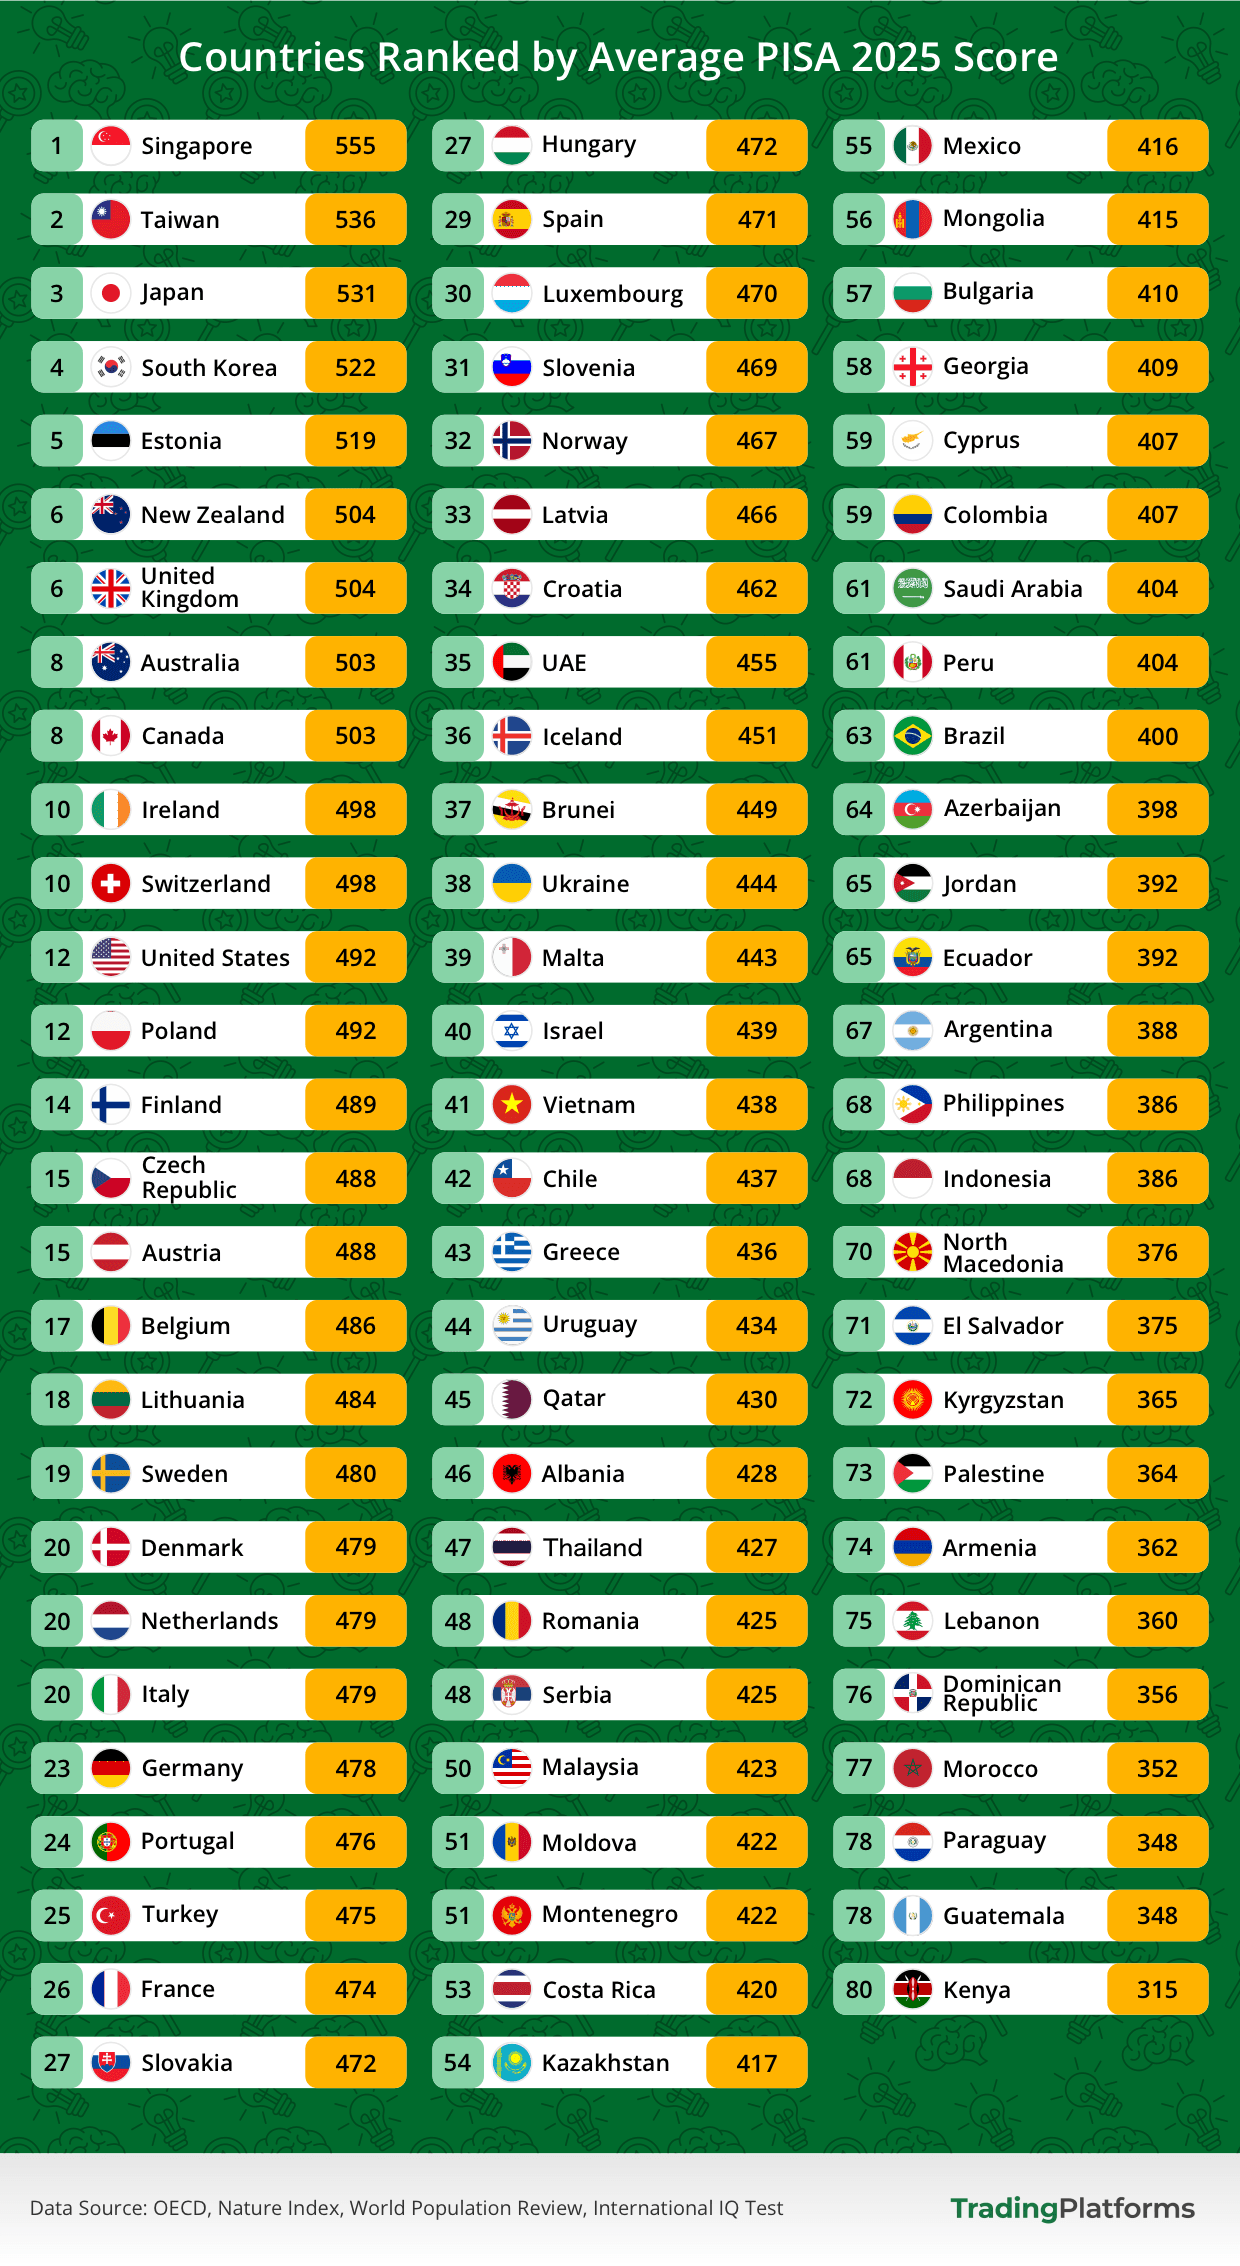
recording an average score of 555 across mathematics, reading, science, and computational problem-solving to take first place in the rankings. Taiwan, Japan and South Korea also make the top five, giving East Asia four of the five highest scores in the study. The region’s strength is particularly evident in mathematics and computational problem-solving, where all four countries rank among the global leaders.This is a result of national curricula that introduce abstract mathematical reasoning early and keep every student on it for longer, rather than separating pupils by ability partway through.
The picture in Europe is more mixed. Estonia stands out, with its students recording an average score of 519 points, placing the small northern European country ahead of every other European nation. Estonia’s results are notable for how evenly they are distributed, with unusually small gaps between its strongest and weakest schools, and it was also among the earliest countries in Europe to put digital skills at the centre of the classroom. The UK follows at 504, ahead of Ireland and Switzerland, which both record an average PISA score of 498. Finland follows at 489, while the gap widens further down the rankings, with Germany, France, Italy and Spain all falling below an average of 480.
North America shows a much wider spread in PISA performance than Europe or East Asia. Canada leads the region with an average score of 503, followed by the United States at 492. The gap then becomes much more pronounced, with Costa Rica recording 420 and Mexico 416, while Guatemala, El Salvador, and the Dominican Republic record averages of 348, 375, and 356, respectively. Canada’s position is particularly strong, with its score placing it among the world’s higher-performing education systems, helped by the consistency of its provincial systems, which produce far smaller differences between schools than the region’s spread would suggest, while the results across Central America and the Caribbean highlight the substantial differences in educational outcomes within the region.
Methodology
To rank the different nations by their intelligence (in relative terms, of course), the team at TradingPlatforms.io combined several metrics for 80 countries around the world to give them a comprehensive ‘Smartness Score ’. Each country’s Smartness Score is constructed from three measurable dimensions: student performance, high-quality scientific output, and measured cognitive ability.
For student performance, we used the latest results from the OECD Programme for International Student Assessment (PISA) for 2025, released in September 2026. PISA tests examine 15-16-year-old students’ performance in mathematics, reading, science, and computational problem-solving. What these tests measure more than anything is cognition and problem-solving. The tests are computer-based and take up to 2 hours, during which time students answer multiple-choice questions, as well as questions where fuller answers are required. For each of the different domains, results are scaled based on an average of 500. For our purposes, we took all four domain scores and calculated their average.
To rank nations’ scientific output, we used the number of high-quality research articles published in 2025 according to the publicly available Nature Index, which tracks research output at the national and institutional level. We looked at research contributions by country between 1 January 2025 and 31 December 2025 and used 2026 population estimates to calculate research output per million residents, allowing us to compare countries of different sizes more accurately.
To get the latest IQ test results for individual countries, we used average national IQ values from the free online International IQ Test website (2026 edition), reflecting the most recently published data.
Each of the three metrics, PISA average, research publications per million residents, and average IQ, was normalised onto a 1-100 scale across the 80 countries, where 100 represents the highest value recorded in the study and 1 the lowest. The three normalised scores were then combined with equal weighting to produce each country’s final Smartness Score. No country scores 100 overall, as that would require ranking first on all three metrics.
China and its special administrative regions (mainland China, Hong Kong and Macao) were excluded from this ranking for two separate reasons. Mainland China is not assessed on a nationally representative basis: OECD only tests a subset of Chinese provinces and municipalities (Beijing, Shanghai, Jiangsu and Zhejiang, reported as “B-S-J-Z”), which cannot be reliably compared to whole-country results elsewhere in this dataset. Hong Kong and Macao, while tested on a fully representative basis for their own populations, are special administrative regions rather than sovereign countries, and were excluded on that basis to keep the ranking consistent with the rest of the list.